Cluster Points
This website describes the setup and the functionality of a subplugin written for the QGIS Processing Toolbox.
The plugin can be downloaded here and the source code is available here.
Introduction
Cluster Points offers a set of cluster tools for an automatical grouping of a point layer in Quantum GIS minimizing the intra-group distance and maximizing the between-group distance: There are two inherently different algorithms the user may choose from. First, there is K/C-Means clustering which randomly initializes the cluster centers and reassigns cluster members until the centers stop moving. Second, there is agglomerative hierarchical clustering which starts with as many clusters as there are points and gradually merges individual clusters according to a certain link function.
Cluster Points works with any point layer and produces a new field Cluster_ID appended to the attribute table as output.
The plugin also offers an incorporation of prescribed attribute fields into the clustering process. To this end, the percentage contribution can be defined for both the geographical coordinates and the whole of these attribute fields.
Cluster Points is a free software and offered without guarantee or warranty. You can redistribute it and/or modify it under the terms of version 3 of the GNU General Public License as published by the Free Software Foundation. Bug reports or suggestions are welcome under the issue tracker.
This plugin was started during the project phase of a GIS-Analyst training course in Berlin (GIS-Trainer). I acknowledge the assistance of the GIS-Trainer tutors and my classmates Juliane, Bennet and Sebastian.
User Manual
Clustering
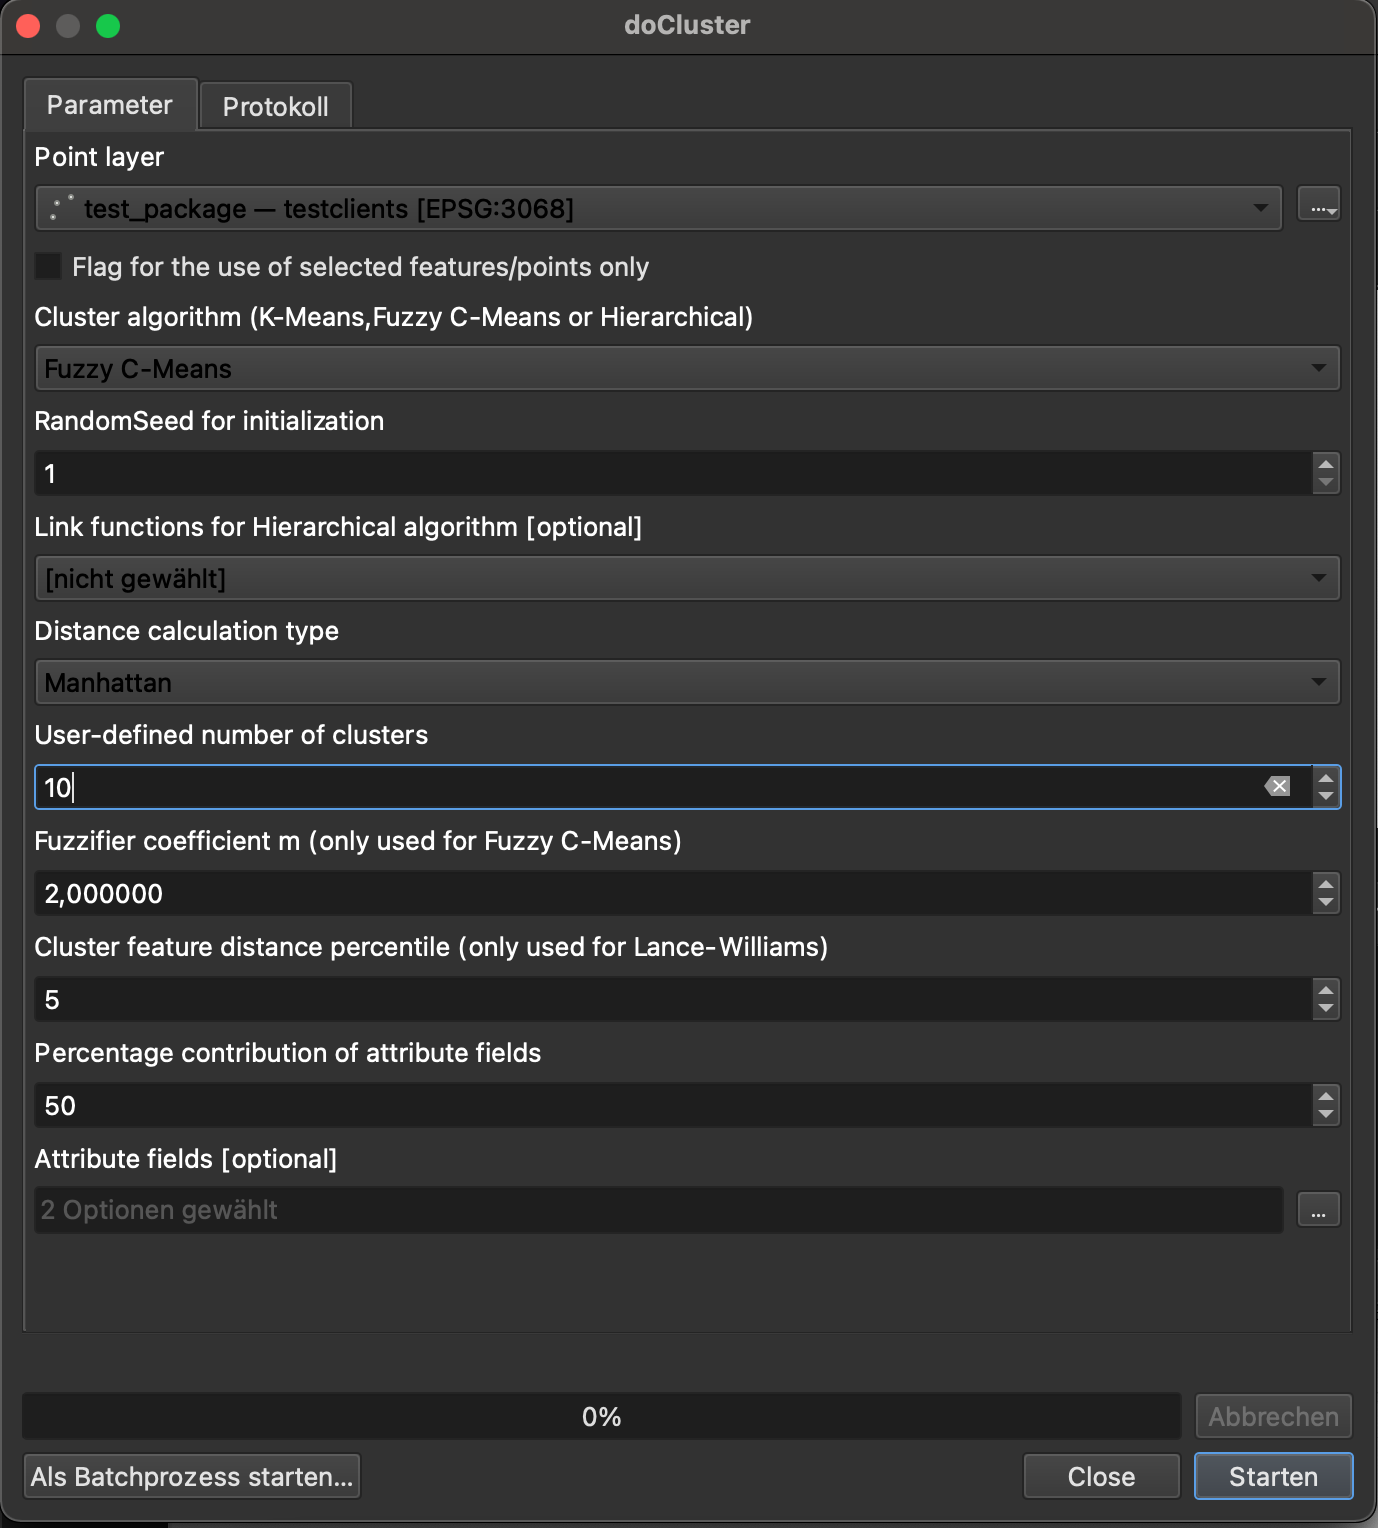
The Clustering Tool offers spatial clustering of a point layer based on the mutual distances between points. Basically, the inter-class distances are maximized whereas the intra-class distances are minimized. The user always needs to define the number of clusters which is sought (minimum is 2). Also, the user needs to decide between the Euclidean distance and the Manhattan distance within the cluster computation. Since the algorithms of K/C-Means are based on a random initialization, a random seed can be specified for this type of clustering to guarantee stable results. For hierachical clustering, a linkage, i.e. link function, must be specified which determines how the distances are measured between individual clusters.
Two inherently different clustering types are available:
-
K/C-Means Clustering
K-Means or C-Means are iterative algorithms which are randomly initialized. For the K-Means, the version of Lloyd is implemented which consists of three steps. First, a user-defined number of clusters is initialized randomly by means of the K-Means++ Algorithm. Then the iteration starts with alternating assignment and updating steps. During the assignment, the points are referred to the closest cluster centers. During the updating, the cluster centers are recalculated from the members which were assigned to a certain cluster. The algorithm stops, as soon as the cluster centers do not move any more. Note that the K-means algorithm is comparatively fast, but it slightly depends on its random initialization and hence does not always produce the same results. To this end, a random seed can be selected to control the randomization and obtain reproducible results.
In order to overcome the rigid assignment of closest cluster centers, the principle of Fuzzy C-Means is made available which works with cluster membership probabilities instead of fixed cluster memberships. The latter algorithms needs slightly more iterations to converge, but is better able to handle sensitive data configurations. The degree of fuzziness is parametrized by the fuzzifier cofficient m. The default value of m = 2 is recommended to applications with missing domain knowledge. A low value of m represses fuzziness, whereas a high value of m promotes fuzziness. -
Hierarchical Clustering
The hierarchical algorithm is agglomerative, i.e. it starts with as many clusters as there are points and sequentially merges the two closest clusters into a composite cluster. The user needs to choose from a set of link functions which describe the way how the two closest clusters are found. More precisely, the user may choose from Single Linkage as well as Complete, Median, Unweighted Average, Ward's or Centroid Linkage. Some helpful information on the characteristics of the link functions can be found here. By gradually merging clusters, the so-called cluster tree is built which shows when individual clusters were merged exactly. Each time two clusters are merged, the distances of the new composite cluster to all the other clusters need to be updated. To do this as efficiently as possible, the SLINK Algorithm can be used for Single Linkage which has computational demands of O(n2) in time and O(n) in memory. Alternatively, the Lance-Williams distance updates can be used with any link function and the underlying distance matrix (upper triangle) is revised in a smart manner. However, due to the essence of the distance matrix, the memory requirements are demanding and computational costs are of O(n3) in time and O(n2) in memory.
Preprocessing Step
To reduce the computational costs, a preprocessing step is provided which defines cluster feature blobs based on a certain radius. This radius is estimated by a prescribed percentile with mutual distances of 250 random points computed and the percentile value derived thereof. Again, a random seed can be selected to control the randomization and obtain reproducible results. If the distance percentile is set to 0, the preprocessing step with the cluster features is omitted. If the distance percentile is greater than zero, the distance of the prescribed percentile is taken from the 250 sample points. After the radius is derived, a cluster feature estimation is performed with computational costs of O(n). This derivation is similar to the classical BIRCH algorithm. However, in contrast to the BIRCH algorithm, there is no size limitation for cluster feature members in the current implementation. The initial points are scanned one after the other. If a certain point falls within the radius of an existing cluster feature, it is added to this cluster feature and the centroid of this cluster feature is adjusted. If a certain point is too distant from all existing cluster features, a new cluster feature is created. Since individual points are updated one after the other, cluster feature membership is not always optimal. To avoid faulty cluster features, an additional optimization step is now performed. This step reassigns individual points, if the formerly assigned cluster feature is not ideal. Finally, the Lance-Williams distance updates are only applied on the centroids of the cluster features and the cluster feature members are assigned the cluster label of the corresponding cluster feature. The higher the distance percentile is set, the less cluster features are found and the faster the algorithm performs. However, the granularity of the spatial assignment is always similar to the cluster feature approximation. Hence, there is a typical trade-off between computational speed and spatial resolution of the clustering.
All former versions (including version number 5.1) offer the output of the new field/attribute labeled Cluster_ID appended to the input layer. All later versions copy the input layer on the canvas and write the cluster information to this copied layer. The Cluster_ID indicates cluster membership of individual points. As an additional output, the Fuzzy C-Means algorithms also offers the new field/attribute labeled Cluster_% to reveal cluster membership probabilities following the IDs of the Cluster_ID.
Incorporation of attribute fields
If any information other than the geographical coordinates needs to be considered, the user may select available numerical fields (Attribute fields) from the input layer to be incorporated into the clustering process. The user can then specify the percentage contribution of these fields as a whole in addition to or as an alternative to the geographical coordinates.
If the percentage contribution is set to 0, then the clustering only considers the geographical coordinates and is purely spatial. If the percentage contribution is set to 100, then the clustering disregards the geographical coordinates and only considers the selected fields. Finally, if the percentage is in between 0 and 100, the clustering is based on a mix of geographical coordinates and the selected fields. In essence, the percentage determines, whether the clustering is rather location-based (low percentage) or attribute-based (high percentage). The numerical fields are standardized to have the same standard deviation as the (horizontal) geographical distances, before they are considered by the given percentage.
Example usage
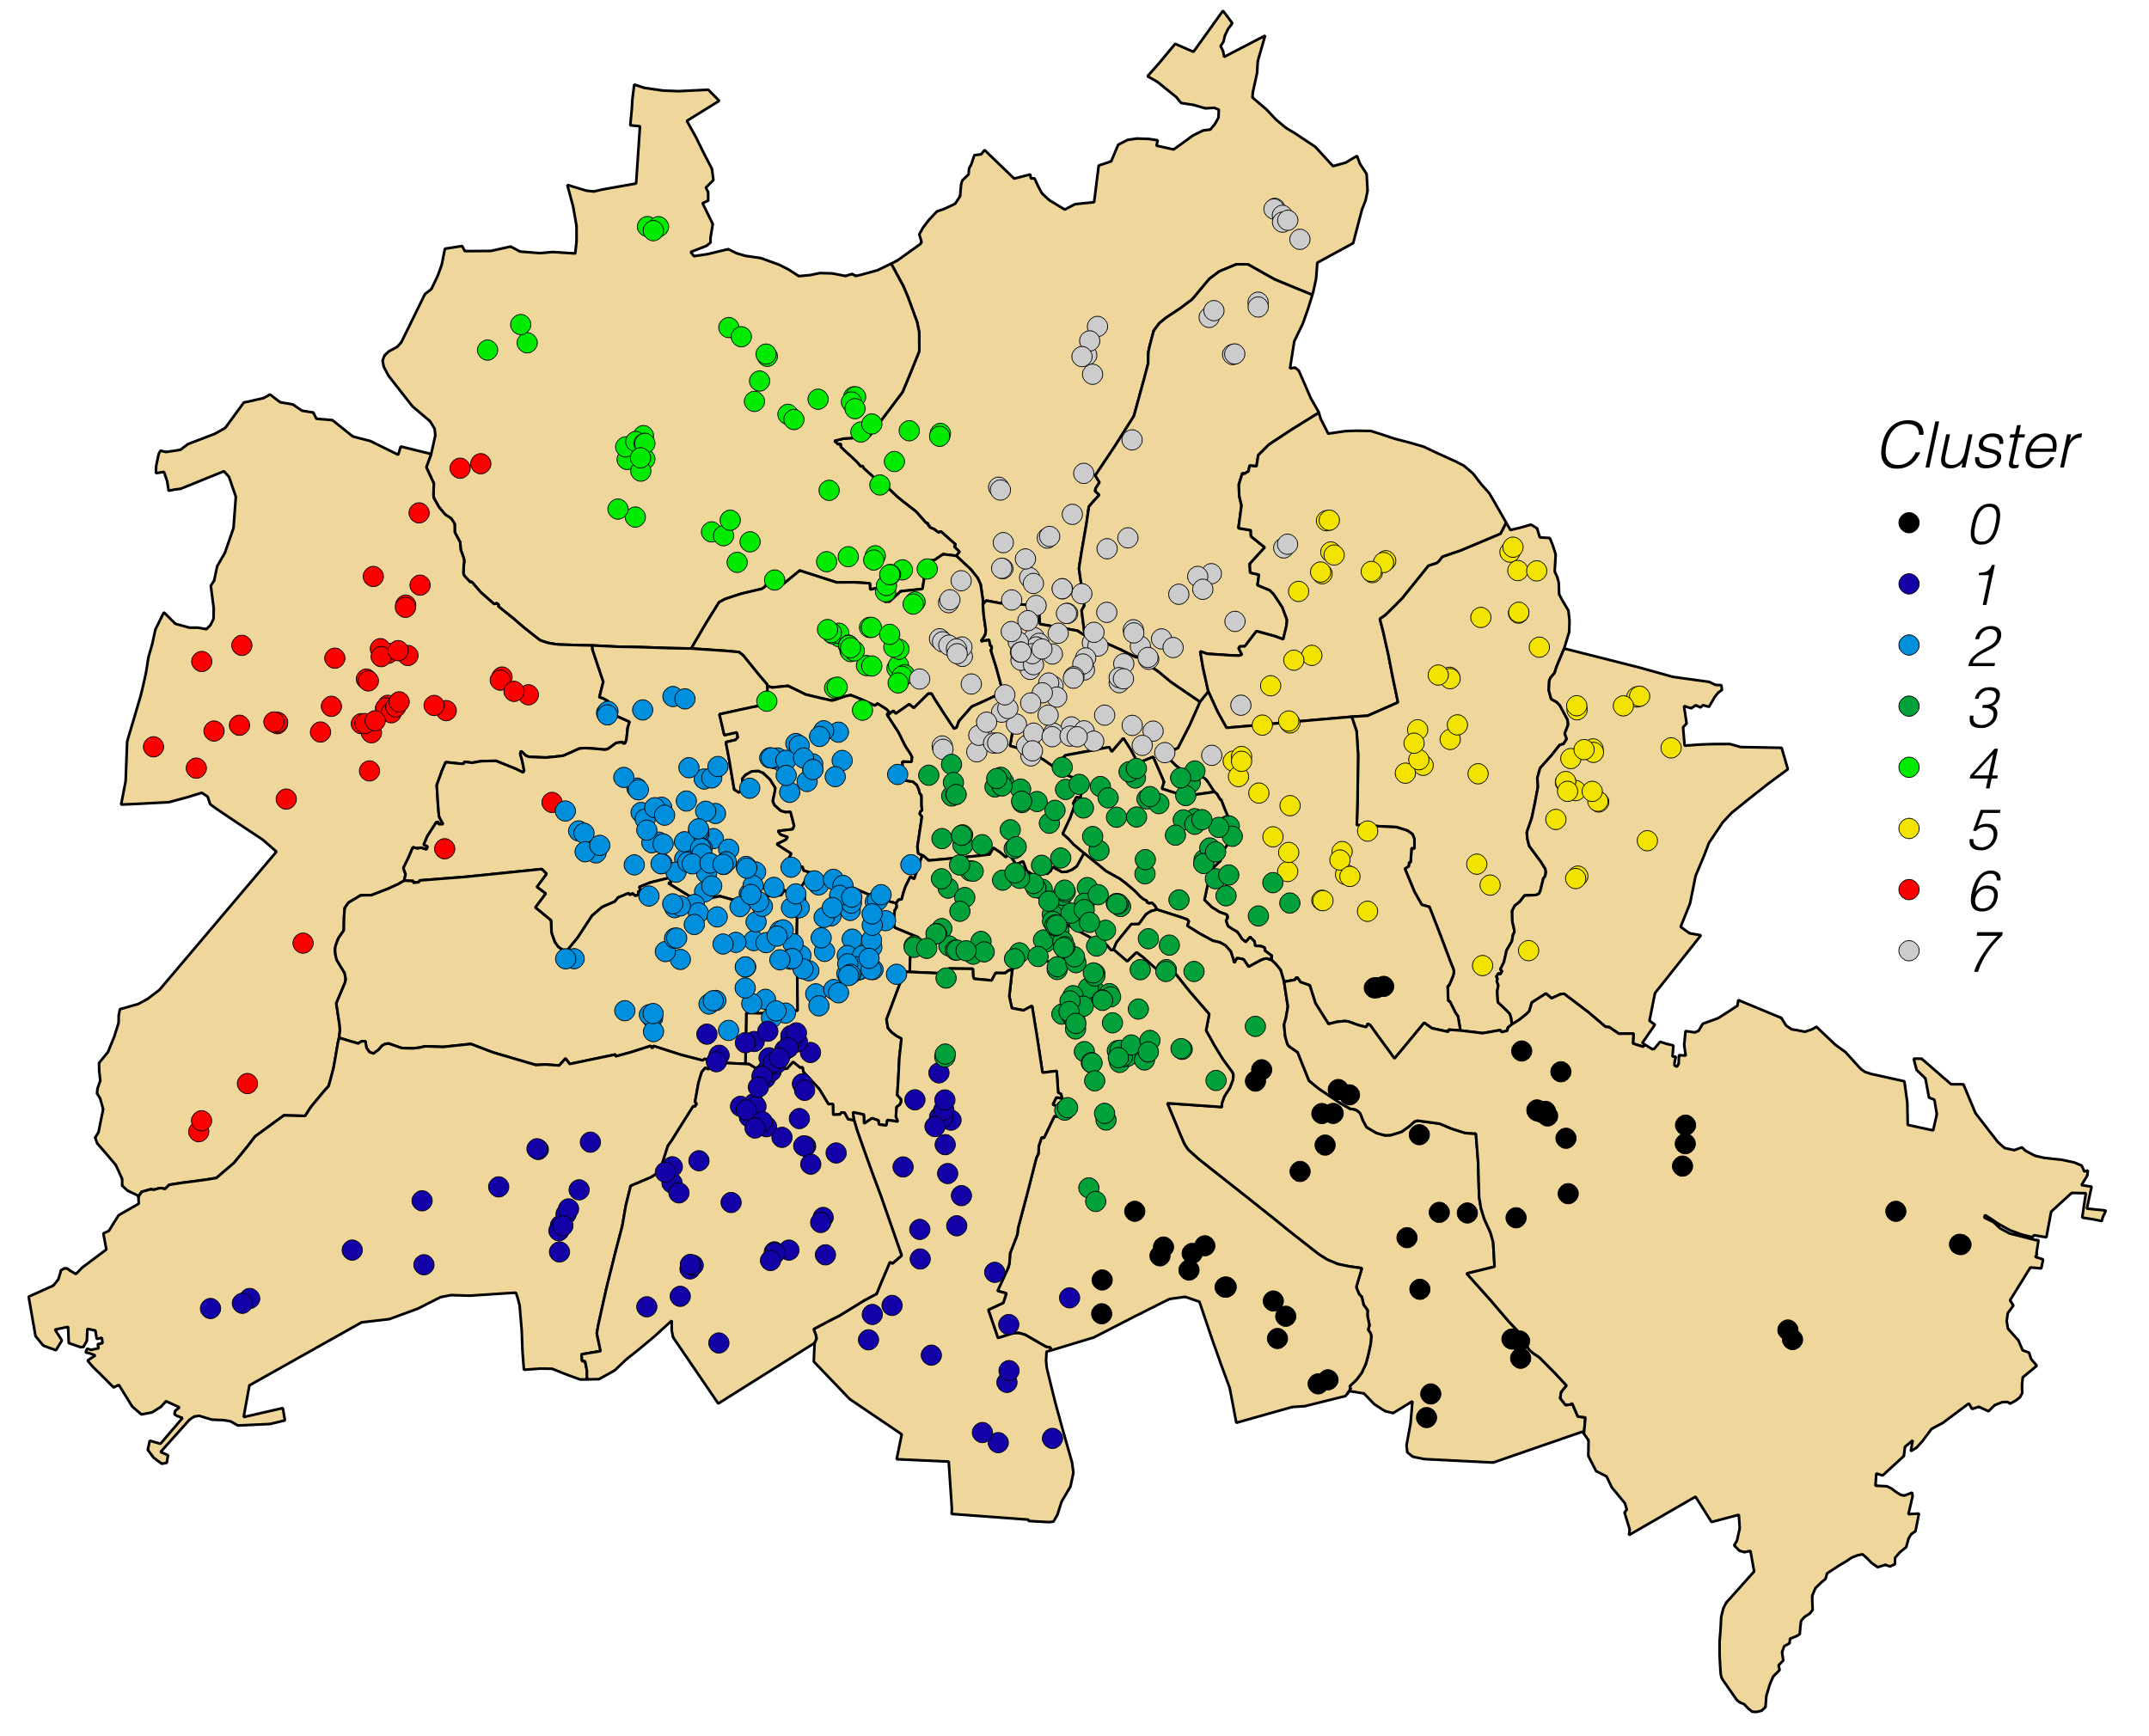
To illustrate the functionality of the plugin, we have a look at some kind of customer addresses of a certain company in Berlin (customer locations shown on the map, polygons delineate Berlin districts). Let's assume the company plans to install 8 new logistics centers across the city and needs to know about the optimum locations to minimize distances between individual logistics centers and customers nearby (875 altogether).
To find the optimum locations, the Clustering is run to find groups of customers who are close to each other. The user sets 8 as the target number of clusters and runs the algorithm (in this case the K-Means). In the original version, the output is a point layer with the same number of points as the input, but with the new field Cluster_ID appended to the attribute table and the cluster members highlighted in color according to their Cluster ID. Later versions just append the field Cluster_ID to the input layer (color highlighting to be done manually, if required). In the end, cluster centers may be found by a standard centroid estimation (not shown here).

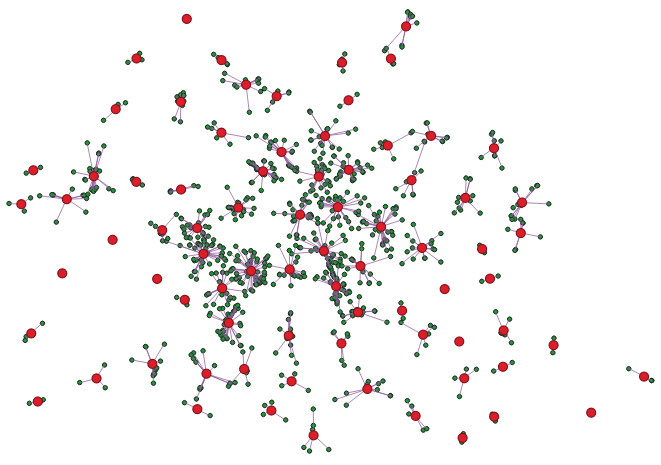
Cluster feature illustration
To speed up the computation of the hierarchical clustering with the Lance-Williams distance updates, the customers are first assigned to 81 cluster features (radius derived from user-defined percentile of sample distances). Then the hierarchical clustering is only done on the 81 cluster features. Finally, individual customers are assigned the Cluster_ID of their cluster feature. Below, the centroids of the cluster features are displayed with bigger markers whereas initial points, i.e. individual customers, are displayed with smaller markers and connected to their cluster features via straight lines.